
Audacity(R) is one of many useful open sourced free software, initially developed for audio and music applications. It is equally useful when adapted (with some limitations) for exploring bio-sensor data sets, such as EEG, ECG, SCR, etc. Audacity(R) is a free, easy-to-use and multilingual audio editor and recorder for Windows, Mac OS X, GNU/Linux and other operating systems. It is equally useful for editing and analyzing bio-signal data files (in .WAV format) such as EEG, ECG, etc. both in the time domain (waveform) and in the frequency domain (FFT).
http://audacity.sourceforge.net/about/ http://audacity.sourceforge.net/download/
Audacity(R) can read bio-sensor data set in .WAV (16bit PCM uncompressed audio file) format, and practically all other audio file formats (mostly compressed and lossy, not suitable for bio-sensor data set). If you have data set in .EDF (European Data File) format, you can use the EDF-to-WAV conversion program to convert them into .WAV file.
1) For viewing EEG, ECG and SCR data sets in the time domain, the default settings should work. To learn more about functionality and features, please go to menu item HELP.
2) For viewing EEG data sets in the frequency domain, the typical FFT settings are as follows:
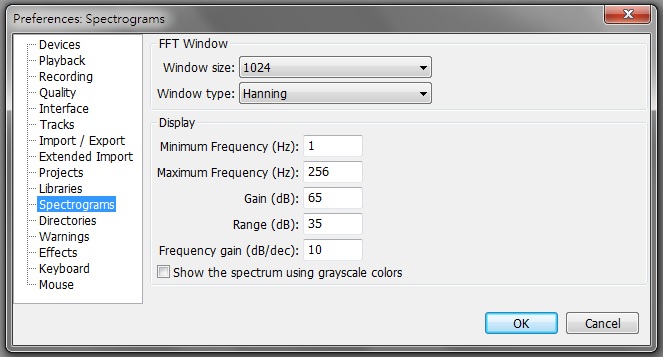
go to menu item EDIT \ PREFERENCES \ SPECTRAGRAMS
FFT Window
Window size: 1024 or 2048 (2" or 4" period)
Window type: Hanning
Display Minimum Frequency (Hz): 1
Maximum Frequency (Hz): 256
Gain (dB): 60~70 (as adjusted by user based on measured signal level)
Range (dB): 35 Frequency Gain (dB/dec): 10 (to equalize 1/f noise floor in typical sensor and ADC setup)
(deselect: show the spectrum in colors)
then most of EEG energy bands can be visually distinguished.
3) Example data files: Examples of EEG and ECG(HRV) Features, Example EEG Features: Left vs. Right.