
Basics of Brain Wave
Our brain contains huge number of individual cells called neurons. Neurons communicate with each other through electrical firings, and individual neuron firing is too weak to be detected at a distance. However, large number of thousands or millions of neurons with synchronized activities can be detected on various scalp locations and are called brain waves (measured in cycles per second, or Hertz) as shown in an EEG (electroencephalogram) chart. The various brain wave frequencies are studied extensively and generally correspond to different types of brain activities.
[excerpt from http://en.wikipedia.org/wiki/Electroencephalography] Scalp EEG activity shows oscillations at a variety of frequencies. Several of these oscillations have characteristic frequency ranges, spatial distributions and are associated with different states of brain functioning (e.g., waking and the various sleep stages). These oscillations represent synchronized activity over a network of neurons. The neuronal networks underlying some of these oscillations are understood (e.g., the thalamocortical resonance underlying sleep spindles), while many others are not (e.g., the system that generates the posterior basic rhythm). Research that measures both EEG and neuron spiking finds the relationship between the two is complex with the power of surface EEG in only two bands (γ and δ waves) relating to neuron spike activity.
Most measured EEG signal contains more than just brain waves, it contains signals from nearby muscle activities (EMG), eye movements (EOG) and skin motions. To isolate these other useful bio-signals from brain waves requires bio-sensor with broad frequency range (more than 240Hz sampling rate, and more than 120Hz signal bandwidth) and wide dynamic range (better than 4000 times change in signal amplitude.) For many bio-sensors designed for toys and games, these other signals often cannot be distinguished correctly and are often misclassified as brain waves.
For analysis, EEG signals are separated into frequency bands (using Fourier transformation) that generally are good indicators for different states and types of activities. Starting from high to low frequencies:
1. EMG or Muscle wave: generally from 80~3000Hz with most energy at 100Hz or above. Generated by muscle membrane electrical potential changes. It is very broadband signal, caused by superposition of many randomly timed activities. Since Muscle wave is much stronger than real brain waves by tens to hundreds times, it can easily “corrupt” most brain wave bands.
2. Super beta (β) or gamma (γ) wave: from 30~150Hz with most energy between 60~100Hz, associated with visual processing, problem solving and memory work. It is a broadband signal, caused by superposition of many randomly timed activities. Generally, the harder the brain works, the stronger the signal will be. It is often used as simple indicator for “Focus or Attention”, but this can be very misleading. When a task is well learned and the brain is becoming more efficient, the brain does not need to work as hard, so this may actually be the “poor-efficiency” indicator.
3. Beta (β) wave: from 12~40Hz with most energy between 20~30Hz, associated with attention and fast activities. It is a broadband signal, caused by superposition of many randomly timed activities. It is often used as simple indicator for “Focus or Attention”, but this can be very misleading. When a task is well learned and the brain is becoming more efficient, the brain does not need to work as hard, so this may actually be the “poor-efficiency” indicator.
4. Spindles or Sigma (σ) wave: generally from 12~14Hz, a burst of waves with unique spindle shaped envelope, it is the most useful and easy to learn marker associated with normal and deeper sleep stages. It is very narrowband signal, caused by synchronized activity of many neurons. The nature of narrowband, or synchronized neuron activity is usually associated with quiescent brain states, and is opposite to those active mental states (γ, β waves) with broadband signals. The σ wave center frequency varies from person to person, and sometimes can be quite far away from the “normal” range.
5. Alpha (α) wave: generally from 8~12Hz with significant variations, associated with relaxation and when eyes are closed. Certain fraction of the population have weak to undetectable alpha waves, and the Alpha wave center frequency varies from person to person. It is very narrowband signal, caused by synchronized activity of many neurons. The nature of narrowband, or synchronized neuron activity is usually associated with quiescent brain states, and is opposite to those active mental states (γ, β waves) with broadband signals.
6. Theta (θ) wave: generally from 4~8Hz, associated with drowsiness. It is a transitional wave, with few distinctive features.
7. Delta (δ) wave: generally from 0.5~4Hz, associated with deep sleep or deep relaxation. It is often in the form of strong pulse train with varying intervals, and thus often covers through δ, θ, α wave bands when it occurs.
By monitoring the relative energy between frequency bands, it’s possible to decode the dominant activity and states (relaxed, attention, excited, drowsy, sleeping, or simply muscle activities.)
Note the frequency bands quoted above generally overlap each other, and do vary from individual to individual, sometimes very significantly. Therefore, for more accurate reading of EEG signals, it is recommended for each person to identify his/her unique EEG frequency bands, using a set of simple routines, rather than assuming everyone is the same.
Example EEG spectrograms:
a) Day Acitivities
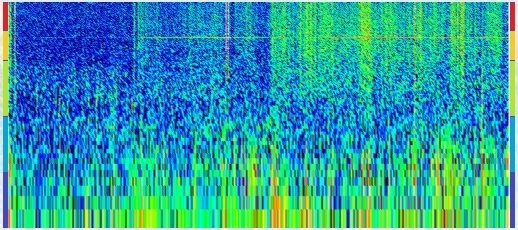
b) Attention (or lack of) watching video clips.

c) Sleep activities.

d) Dozing during meditation.
