
Several EEG examples are shown here, from different individuals and comparing right and left top forehead signals, to highlight the features and differences between peoples. Top trace shows Right side EEG, second trace shows Left side EEG, and if there is a third trace showing accelerometer Z data for head posture and movements.
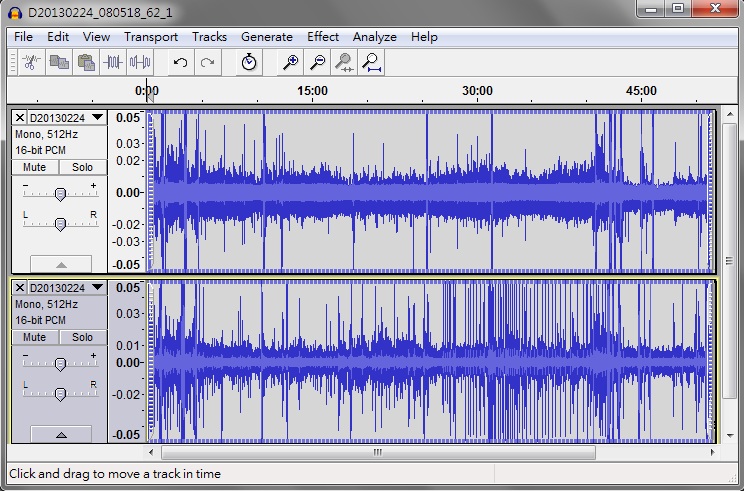
1. Person1: showing signal waveforms with very distinct differences in amplitudes and features. Watching videos and ebook.
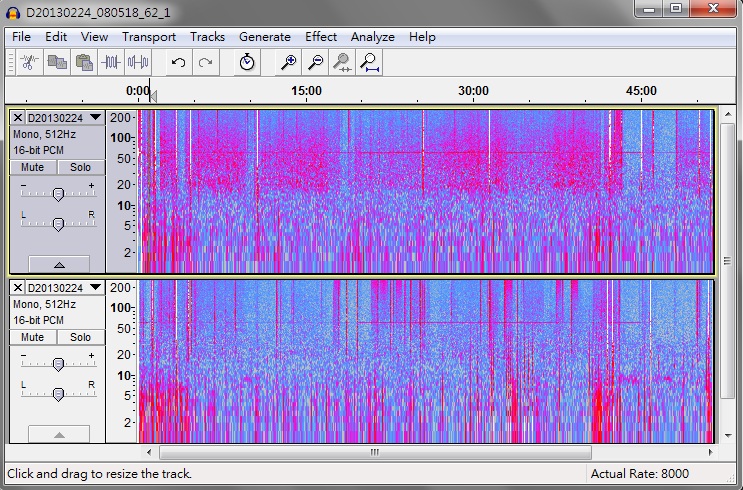
2. Person1: showing the same signals in spectrogram, notice the alpha wave at ~9Hz, muscle (EMG) activities from 256Hz and down (strong white lines), Gamma band (centered around 40~100Hz) activities when visual perceptions are active. Beta band (around 20Hz) activities with visual and other activities.
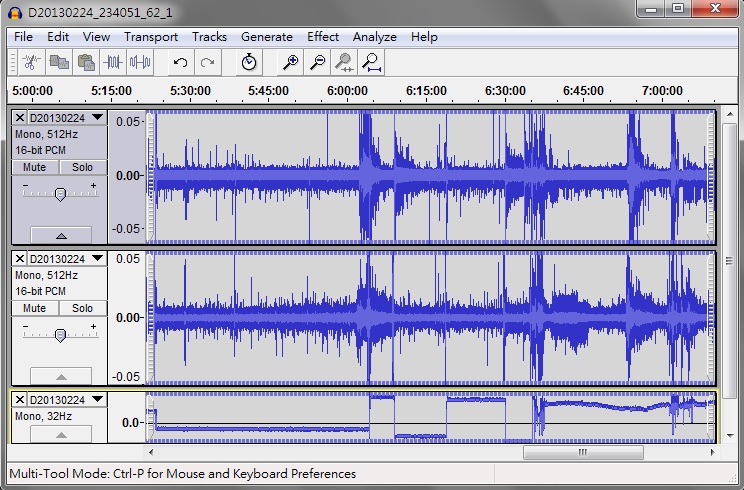
3. Person2: showing signal waveforms for sleeping followed by meditation. Very distinct differences in amplitudes and features. The accZ data showing the head posture and movements.
4. Person2: showing the same signals in spectrogram, notice the sigma wave (sleep spindles) at ~30Hz, very different from "typical" 10~14Hz range. There are also many strong delta wave peirods.
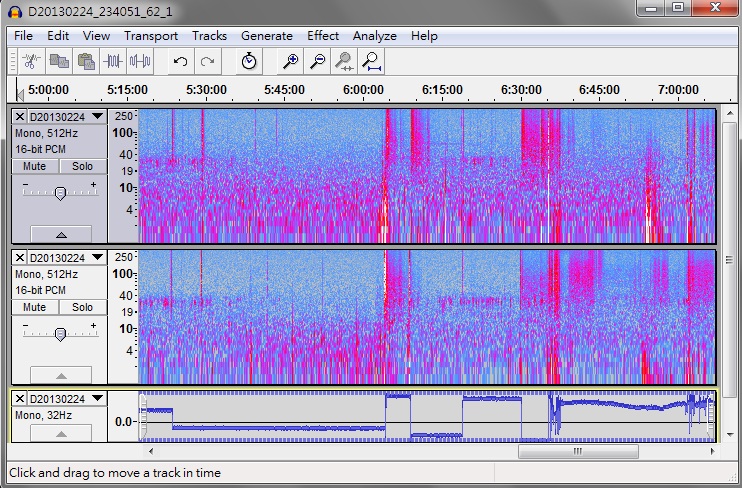
From these example EEG datasets, it's clear that limited bandwidth (or filtered) EEG recording (typically from 2Hz ~ 40Hz) will be missing a lot of meaningful information pertinent to a person's brain activities. A broad bandwidth (and preferably un-filtered) EEG recording (from 0.3Hz ~ 256Hz) can incorporate sufficient information to further differentiate different types of brain activities.